Как включить и синхронизировать несколько графиков на экране?
На платформе не хватает настроек вида с несколькими графиками. В отличие от платформы TradingView, которая включает настройки, такие как тикер, интервал, перекрестие, синхронизация времени и дат, несколько графиков на нашей платформе в настоящее время работают независимо друг от друга. Кроме того, линии ордера и позиции не видны на нескольких графиках и доступны только на одном графике.
Выберите один из доступных режимов торговли в меню главной страницы, чтобы загрузить график
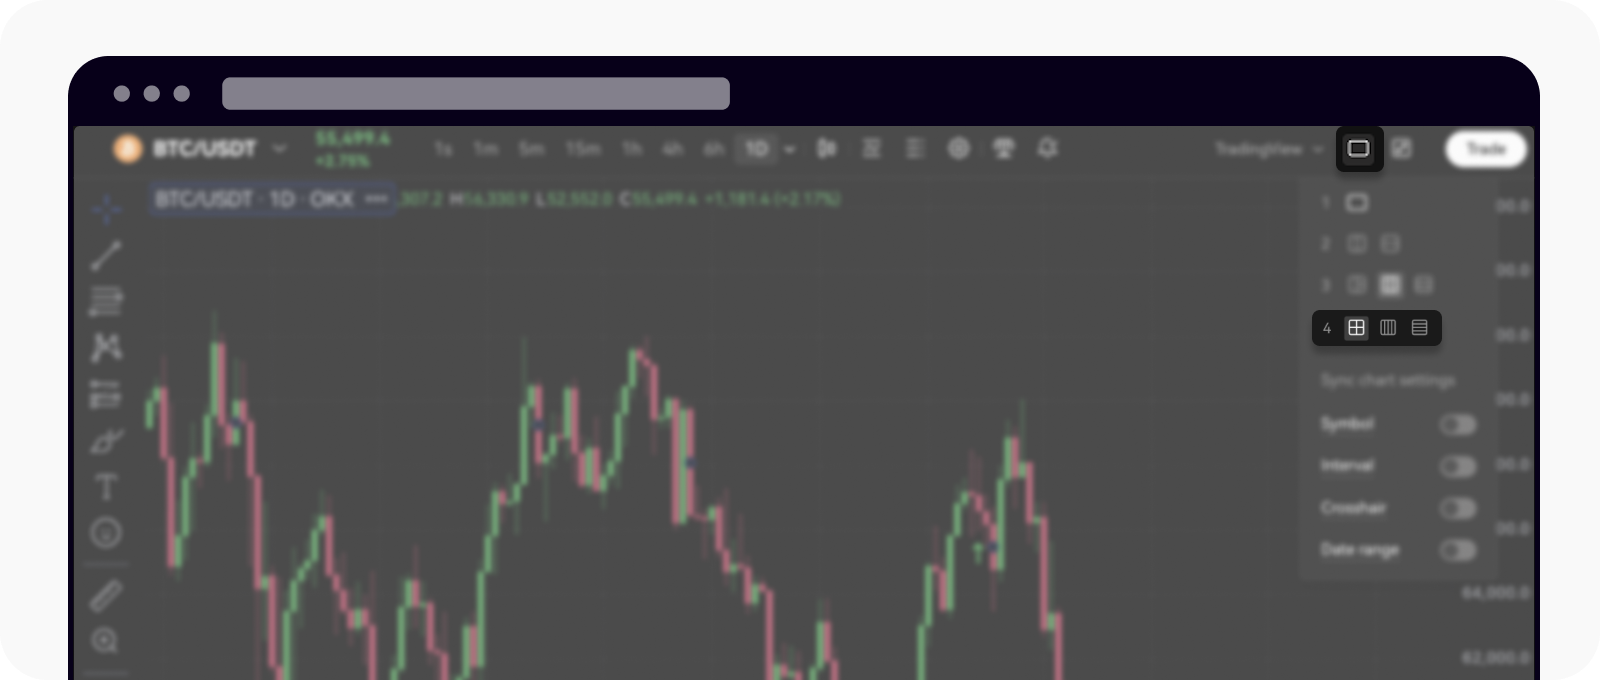
Выберите Несколько графиков в главном меню графика
Выберите расположение графиков и до 8 графиков

Задайте вариант расположения графика и выберите восемь графика
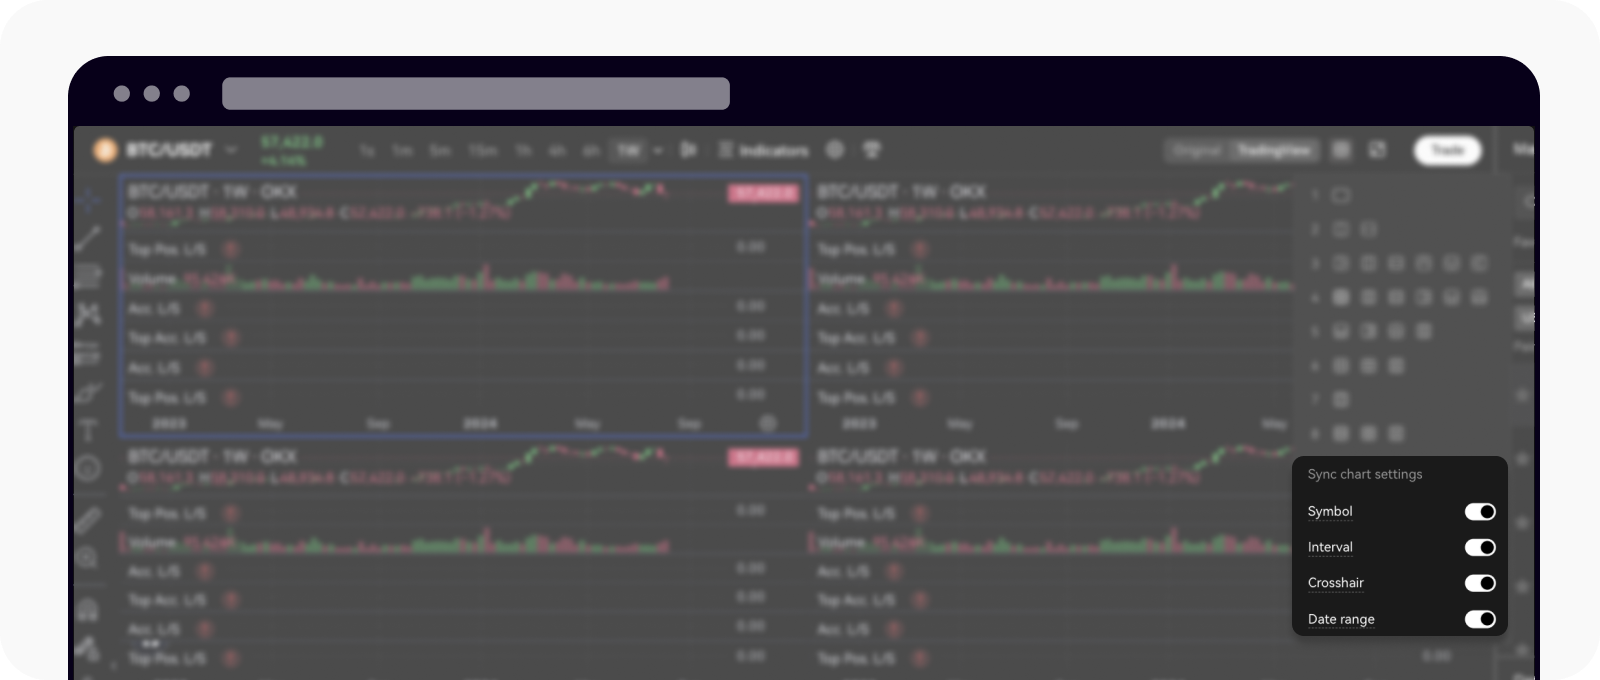
Синхронизируйте интервалы, перекрестие и диапазон дат в разделе Настройки синхронизации графика

Вернитесь к графику и настройте параметры синхронизации
Перейдите на эту страницу, чтобы узнать больше о том, как эффективнее торговать.
Часто задаваемые вопросы
Можно ли просматривать графики разных торговых пар одновременно?
Да, вы можете выбрать другую торговую пару для каждого графика в режиме нескольких графиков, чтобы сравнивать их.
Сколько графиков можно открывать одновременно?
Как правило, платформа поддерживает до четырех графиков на экране. Однако это зависит от устройства и используемой версии платформы.
Можно ли использовать разные временные интервалы на графиках?
Да. На каждом графике можно анализировать разные временные интервалы.
Доступны ли все торговые инструменты и индикаторы в режиме с несколькими графиками?
Да, вы можете добавлять индикаторы и инструменты к каждому графику по отдельности, как и в режиме с одним графиком.
Можно ли изменить расположение графиков после настройки?
Да, расположение можно менять в любое время, выбрав новую конфигурацию нескольких графиков.

