How do I display historic orders on the chart?
You'll be able to activate the display of historic orders directly on the trading chart. This feature allows you to view past executed trades, including their price points, quantities, and timestamps, offering a visual representation of your trading activity over time.
By analyzing historic orders, you can better understand market behavior, identify recurring patterns, and assess the effectiveness of your trading strategies. This tool is especially helpful for spotting key price levels, refining entry and exit points, and improving decision-making in future trades.
Below is how you can start displaying your historic orders on the chart:
Select Display on the trading chart
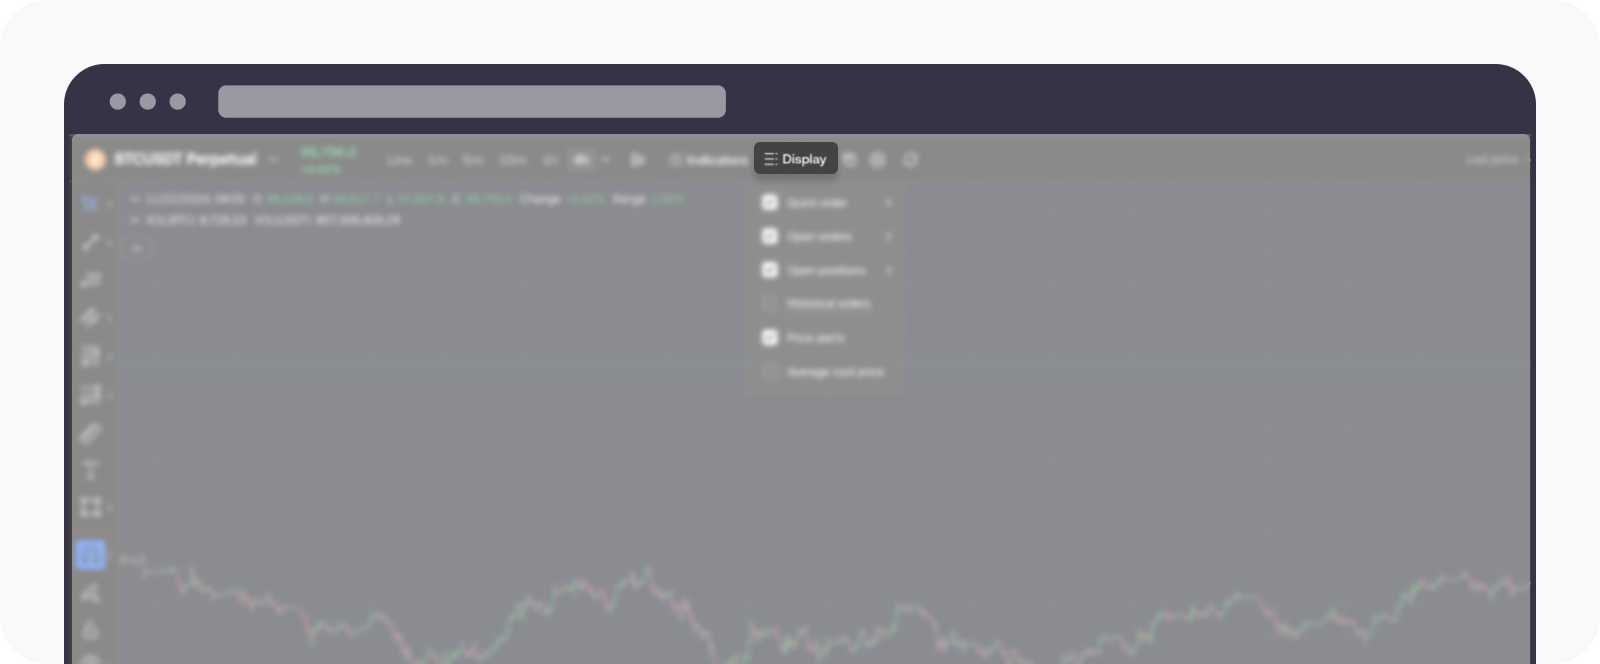
Head over to the main menu on the trading chart and select Display
Select Historical Orders
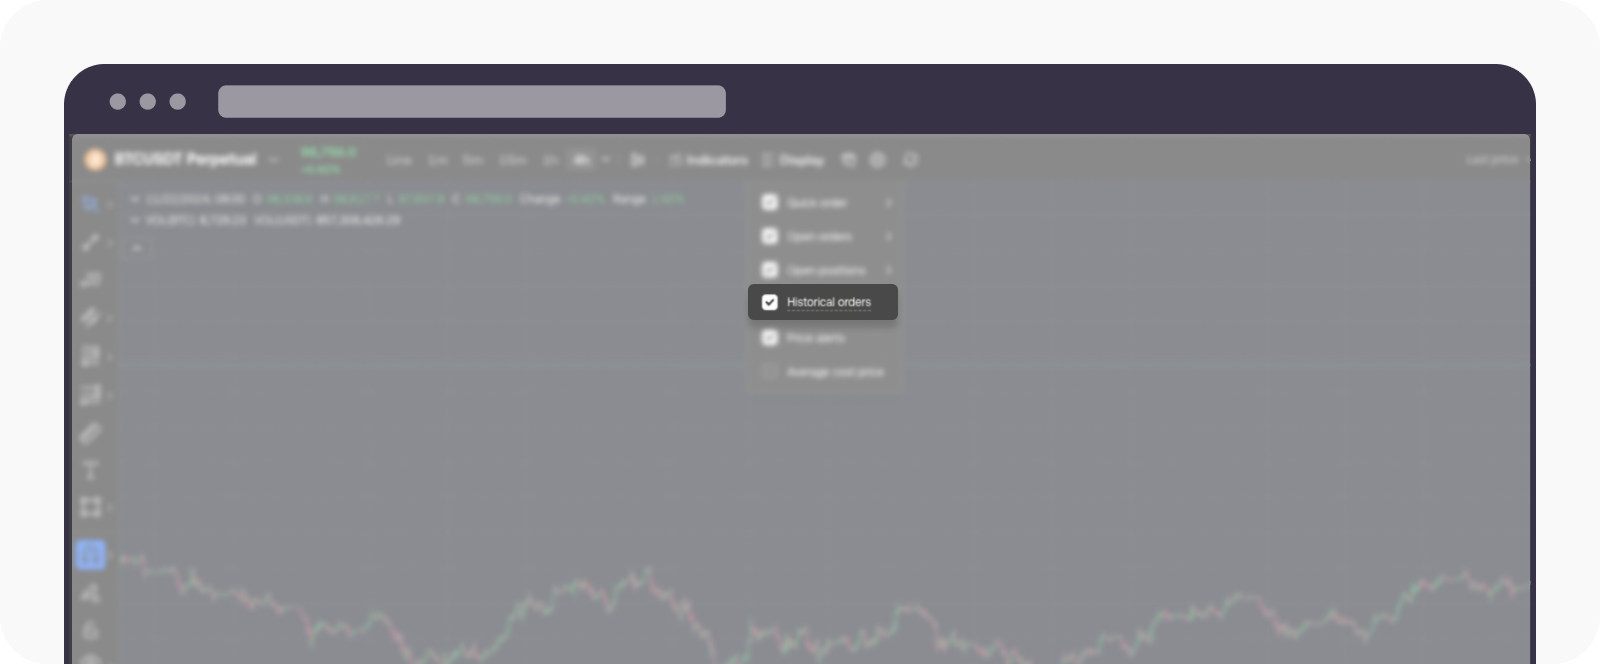
Tick the Historical orders option to enable it
Your historical orders will appear on the chart
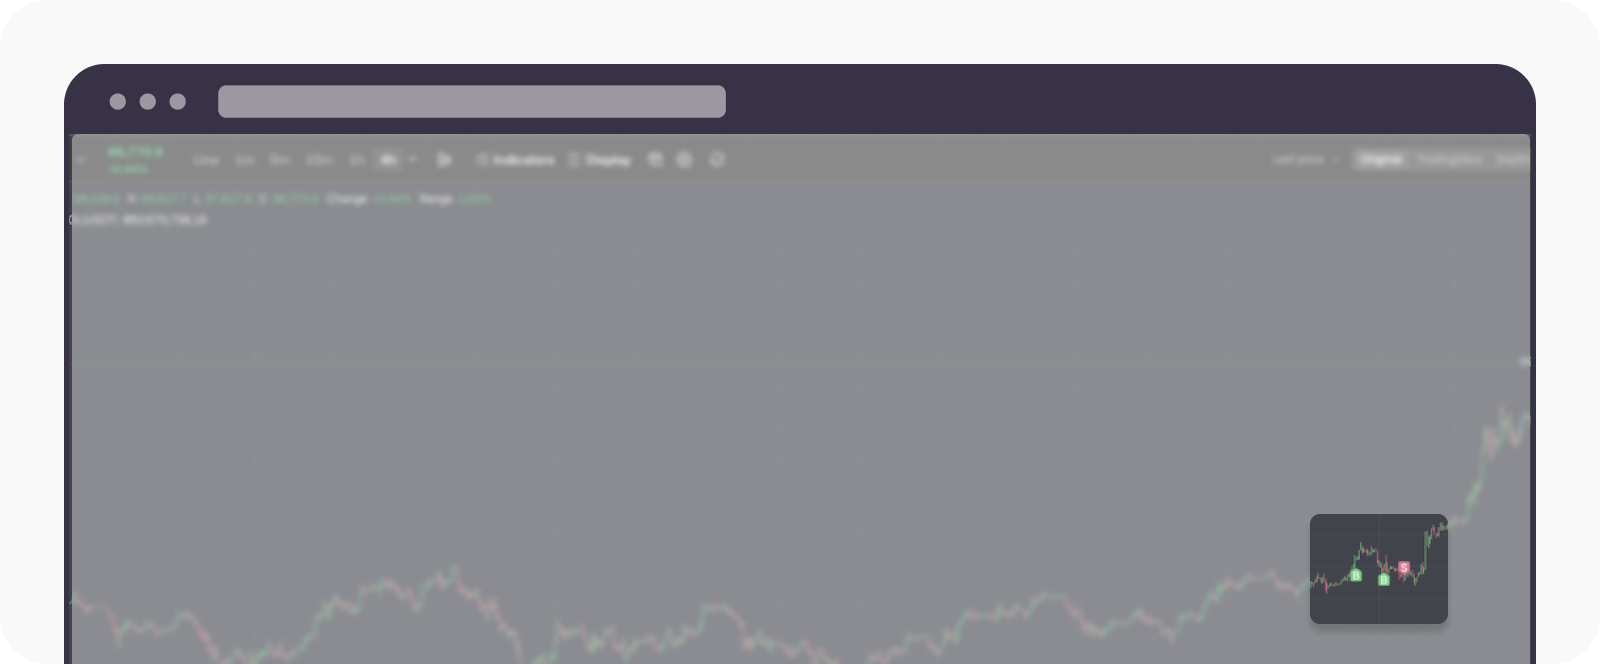
Once the page loads up, look up the historical order
Hover over the historical order to view the details of your historical trade. Select the View details to view more info about it
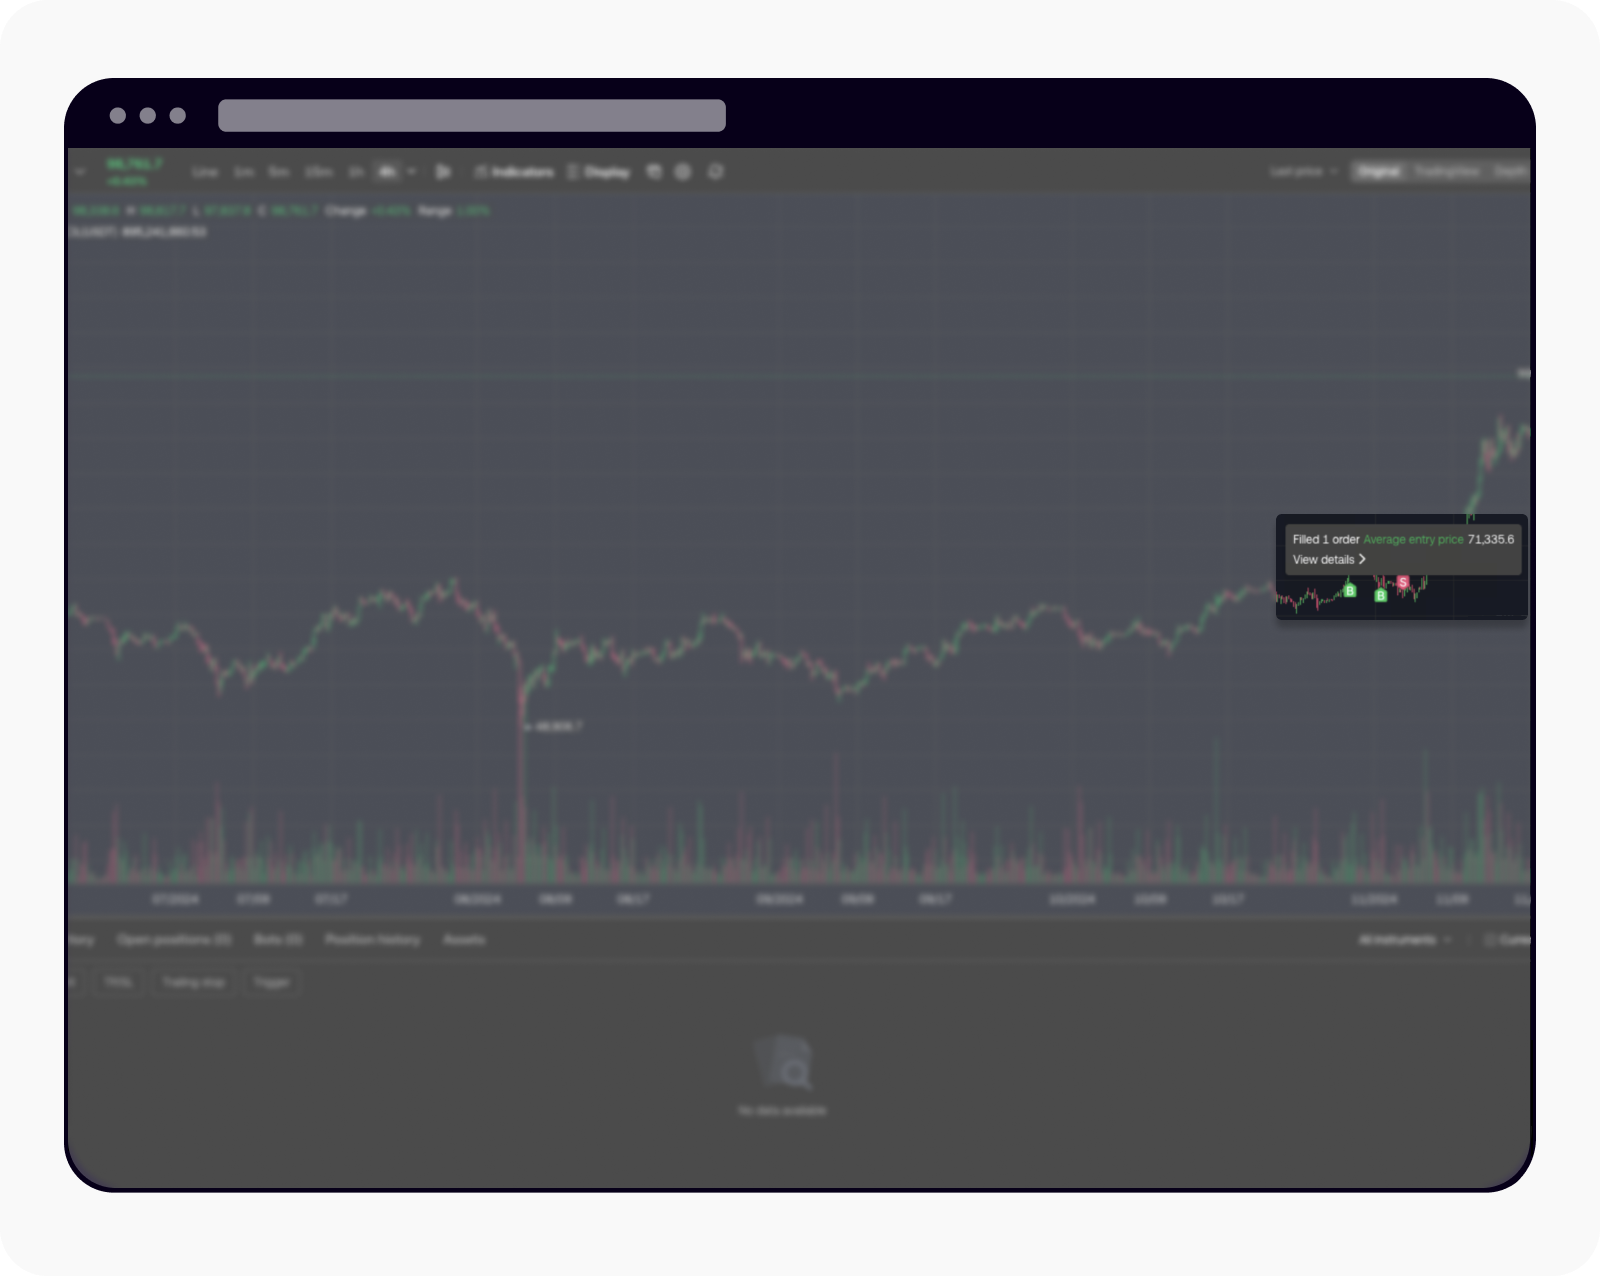
Place your mouse on the historical order to view more details
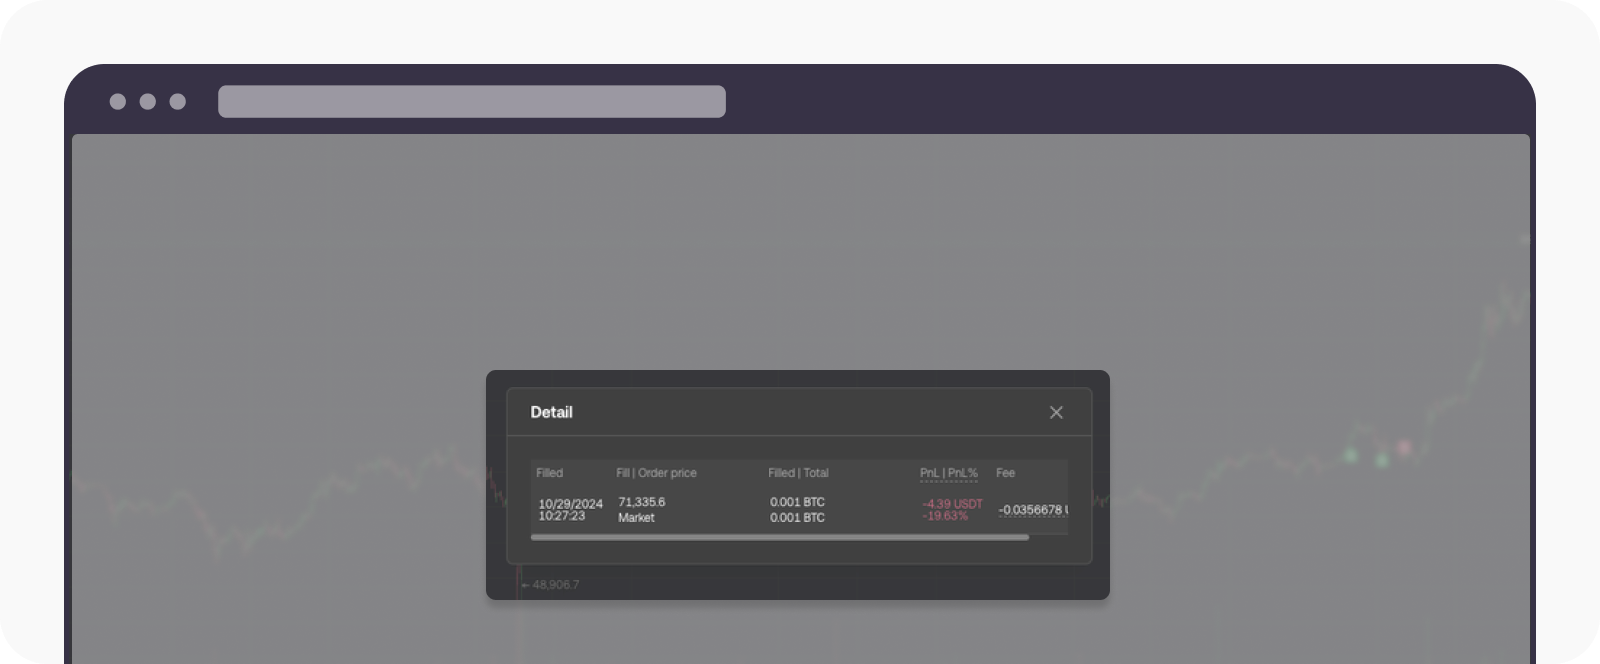
Once the details are selected, more info on the order will appear
If you're wondering how you can switch on the trade confirmation on your trade, visit here.


